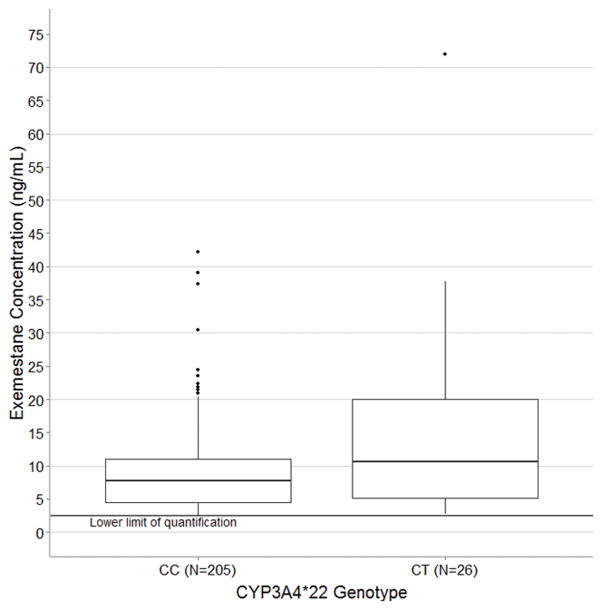
Figure 1.
Exemestane concentration stratified by CYP3A4 genotype comparing patients homozygous (CC, n=206) and heterozygous (CT, n=25) for the wild-type C allele. No patients included in this analysis were homozygous for the variant T allele. Concentrations below the LLOQ of exemestane (2.5 ng/mL) were censored at that value. Patients carrying the CYP3A4*22 allele had significantly greater median exemestane concentration (10.7 ng/mL vs. 7.7 ng/mL, p<0.01). In the box-and-whisker plot the middle line represents the median, the box represents the inter-quartile range (IQR), and the whiskers extend to 1.5 × IQR.

