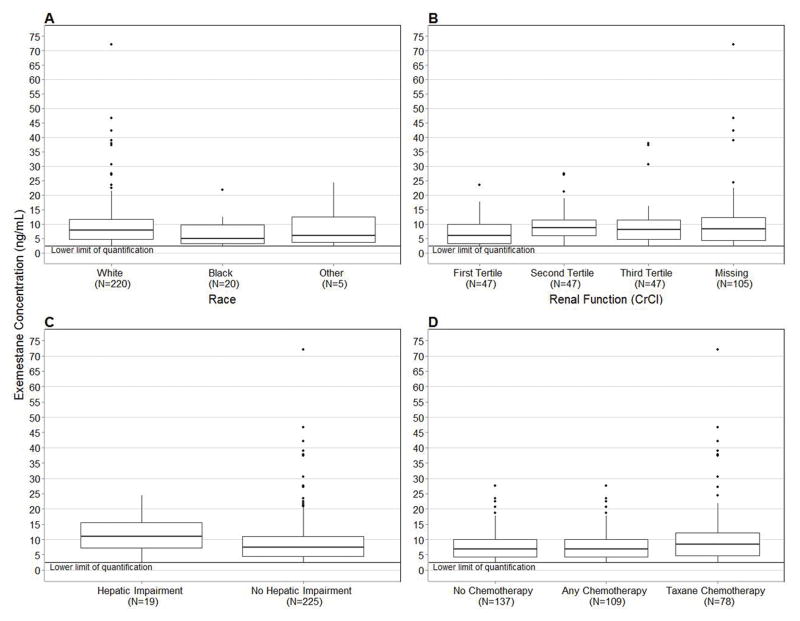
Figure 2.
Clinical variables with significant associations with exemestane concentration. Concentrations below the LLOQ of exemestane (2.5 ng/mL) were censored at that value. 2A) Patients who self-reported as White had greater exemestane concentration compared with self-reported Black patients (7.9 ng/mL vs. 5.0 ng/mL, p=0.03). 2B) Patients in the first tertile of creatinine clearance (CrCl > 108.5 mL/min) had the lowest exemestane concentration (5.9 ng/mL vs. 8.6 ng/mL vs. 8.0 ng/mL, p=0.01). 2C) Patients with elevated aminotransferase levels (AST or ALT>40) had greater exemestane concentration (11.0 ng/mL vs. 7.5 ng/mL, p=0.05). 2D) Patients who received prior chemotherapy had lower exemestane concentration (6.9 vs. 8.7, p=0.03). In all box-and-whisker plots the middle line represents the median, the box represents the inter-quartile range (IQR), and the whiskers extend to 1.5 × IQR.

