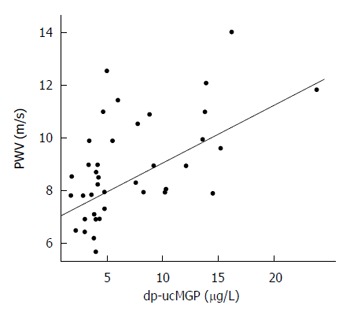
Figure 4.

Linear regression model highlighting the direct correlation between plasma concentration of dephosphorylated-uncarboxylated matrix Gla-protein and pulse-wave velocity (β = 0.219, R2 = 0.293, P = 0.0004). dp-ucMGP: Dephosphorylated-uncarboxylated matrix Gla-protein; PWV: Pulse-wave velocity.
