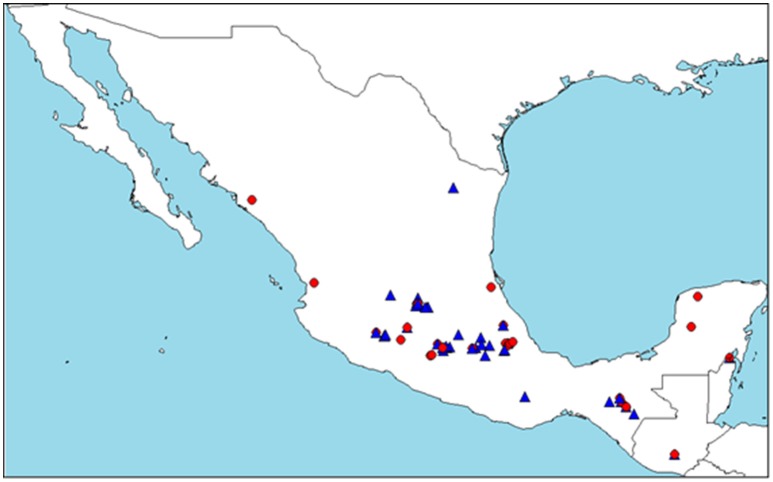
Figure 1.
Geographical distribution of assignment results of STRUCTURE (K = 2) analysis. Only the accessions assigned more than 80% to one of the clusters (A or B) were plotted on the map. The red circle represents Cluster A and the blue triangle, Cluster B. Distribution of the accessions originated in Mexico and Guatemala are shown.

