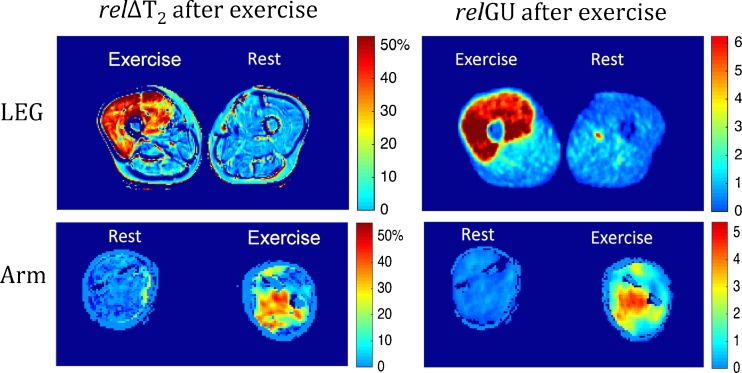
Fig. 3.
MRI (relΔT 2) and 18F-FDG PET (relGU) images of legs and arms after exercise. Top: Cross sections of the mid-femurs in the same subject after unilateral exercise of the quadriceps of the right leg. Bottom: Cross sections of the forearms at maximum diameter in the same subject after exercise of the left arm. For both the arms and the legs, the images show the relative increases in T 2 values (relΔT 2 as precentages) and relative increases in SUV values (relGU as ratios)

