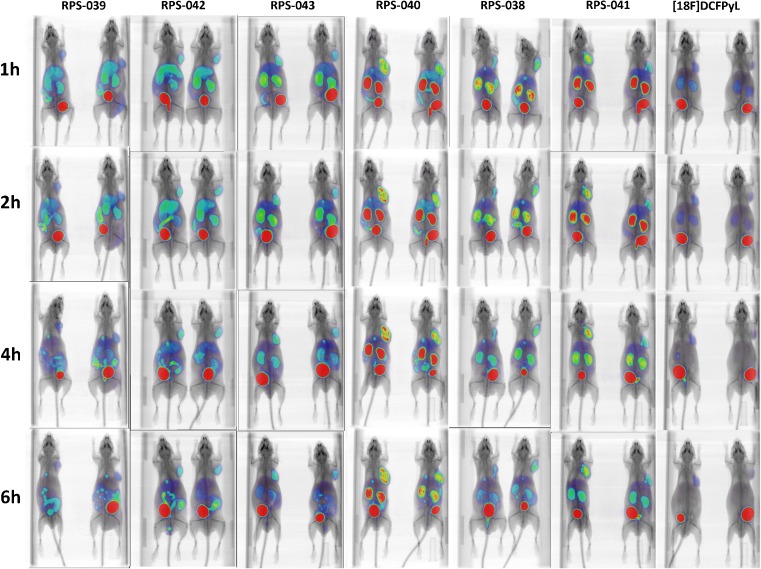
Fig. 4.
Micro-PET/CT images of a series of [18F]fluorinated PSMA ligands in LNCaP xenograft tumor-bearing mice. Mice (n = 2 per time point) were imaged at 1 h, 2 h, 4 h and 6 h p.i. All images are scaled to correct for decay and the highest tumor uptake image (RPS-040; 2 h p.i) is used as the reference for setting the intensity scale

