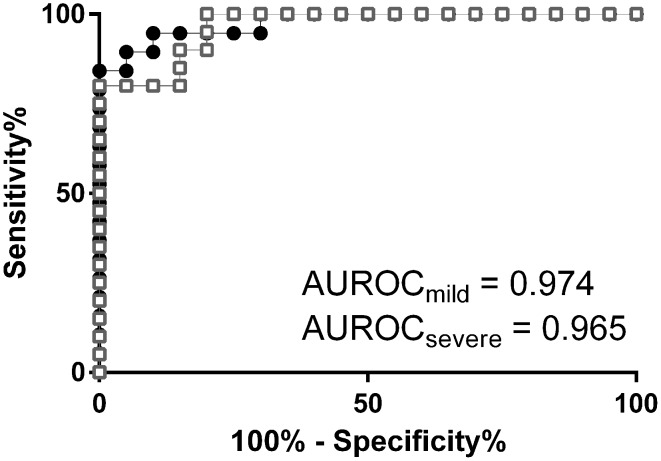
Fig. 3.
Lipid signature patterns as diagnostic separators. Diagnostic performance of lipid profile signature for severe malaria (white squares; AUROC = 0.9180 to 1.012 at 95% CI, p < 0.0001) and mild malaria (black dots; AUROC = 0.9329 to 1.015 at 95% CI, p < 0.0001); values of cross-validated predictive vector (t[1]cv) from the OPLS-DA models were taken for the ROC curves calculation

