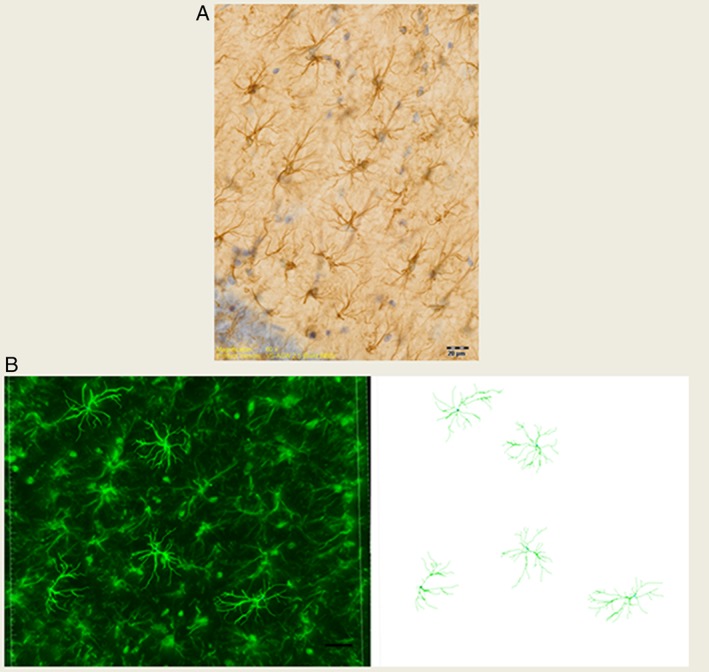
Figure 1.

(A) This GFAP immunostained image was captured from the CA1.SR area of rat hippocampus using a 60× objective. Scale bar is 20 μm. (B) 3D reconstruction of GFAP positive astrocytes in the CA1.SR subregion of the rat hippocampus by using Filament Tracers Algorithm in Imaris software. Scale bar is 20 μm.
