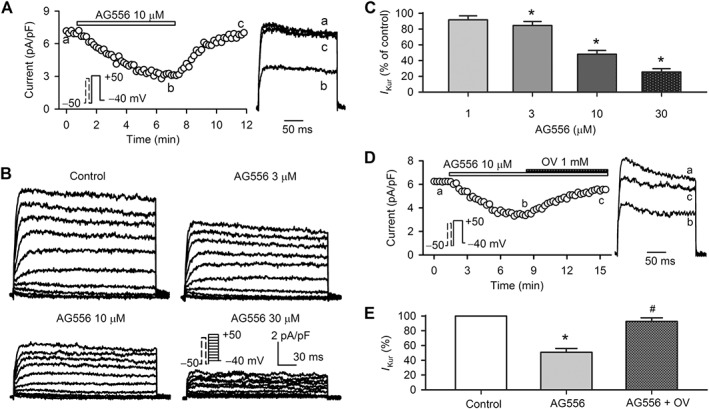
Figure 3.

Effect of AG556 on human atrial I Kur. (A) Time course of I Kur recorded in a typical human atrial myocyte in the absence and presence of 10 μM AG556. I Kur traces at corresponding time points are shown in right of the panel. (B) Family of I Kur recorded in a representative cell using the voltage protocol shown in the inset during control and application of 3, 10 and 30 μM AG556. (C) Percent values of I Kur at +50 mV in cells treated with 1, 3, 10 and 30 μM AG556 (n = 6). *P < 0.05 , significantly different from control. (D) Time course of I Kur recorded in an atrial myocyte in the absence and presence of 10 μM AG556, and AG556 plus 1 mM orthovanadate (OV). I Kur traces at corresponding time points are shown in right side of the panel. (E) Percent values of I Kur (at +50 mV) in the absence and presence of 10 μM AG556 or AG556 plus OV (n = 7). *P < 0.05, significantly different from control; #P < 0.05, significantly different from AG556 alone.
