
Figure 3.
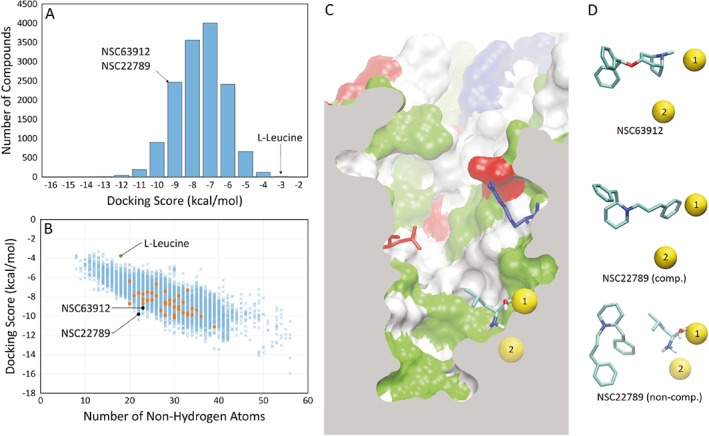
Trends in molecular docking scores and poses of specific B0AT1 inhibitors (A). Histogram of the docking score of all compounds screened, sorted into 1 kcal·mol−1 bins. (B) Docking score of all compounds screened compared to their molecular weight as approximated by the number of non‐hydrogen atoms present in the compound. The first batch of 40 compounds was chosen for functional testing (orange points). Substrate L‐leucine and two identified inhibitors (NSC63912 and NSC22789) are highlighted. (C) Cutaway of B0AT1 homology model showing a side profile of the substrate binding site. Highlighted are sodium ions 1 (accessible to substrate) and 2 (inaccessible to substrate) in their binding sites (yellow spheres), and the Arg57 and Asp486 residues that form the extracellular gate to the binding site. The protein surface is represented, where white represents non‐polar amino acids, green represents polar amino acids, red represents acidic amino acids and blue represents basic amino acids. (D) The most favourable docked pose of NSC63912 and NSC22789, respectively, alongside the sodium ions for reference. A second major pose for NSC22789 highlights a non‐competitive binding location, showing leucine at the substrate binding site for reference.