
Figure 1.
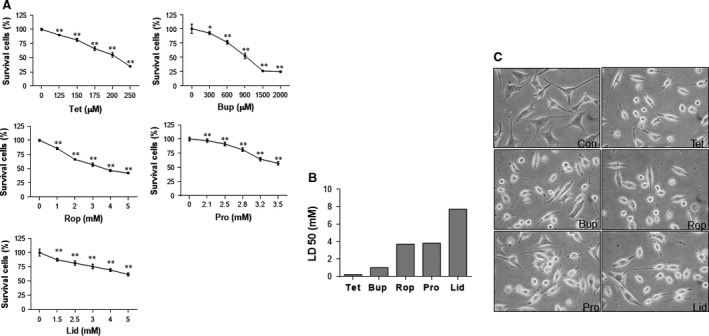
Neurotoxicity of LAs in SH‐SY5Y cells. (A) Dose–effects relationship. Cells were challenged with tetracaine, bupivacaine, ropivacaine, procaine, lidocaine for 24 hrs at the indicated concentrations. Cell viability was evaluated by MTT assay. **P < 0.01 and *P < 0.05 versus untreated controls. n = 3–6 per group. (B) LD50 (Median lethal dose). The LD50 was calculated based on the measurement of dose effects of LAs on cell death in A. The neurotoxicity of LAs was tetracaine > bupivacaine > ropivacaine > procaine > lidocaine. n = 3–6 per group. (C) Cellular morphology. Cells were treated with LAs for 24 hrs. Cell morphology was observed under a phase‐contrast microscope at a magnification of 400×. Representative images from three independent experiments are shown. Con: control; Tet: tetracaine; Bup: bupivacaine; Rop: ropivacaine; Pro: procaine; Lid: lidocaine.