Figure 4.

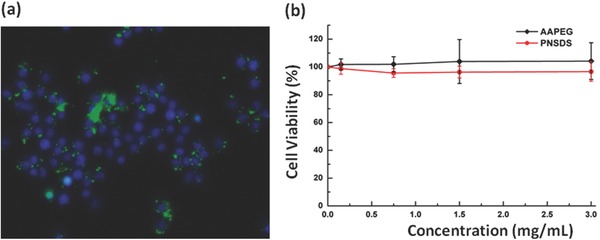
a) Fluorescence images showing internalization of PNSDS‐FAM‐siRNA‐in RAW 264.7 cells. b) Cell viability results after incubation of macrophage cells with various concentrations of AAPEG and PNSDS.

a) Fluorescence images showing internalization of PNSDS‐FAM‐siRNA‐in RAW 264.7 cells. b) Cell viability results after incubation of macrophage cells with various concentrations of AAPEG and PNSDS.