Figure 1.

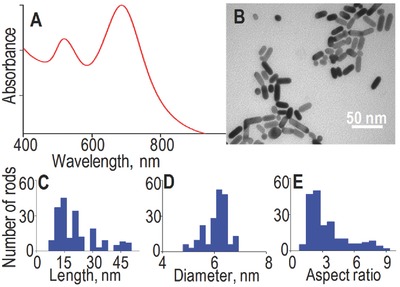
A) UV/Vis absorption spectrum, B) TEM image and C) corresponding length, D) diameter, and E) aspect ratio histograms of as‐prepared nanorods. Here, ≈200 nanorods are used to construct the histograms.

A) UV/Vis absorption spectrum, B) TEM image and C) corresponding length, D) diameter, and E) aspect ratio histograms of as‐prepared nanorods. Here, ≈200 nanorods are used to construct the histograms.