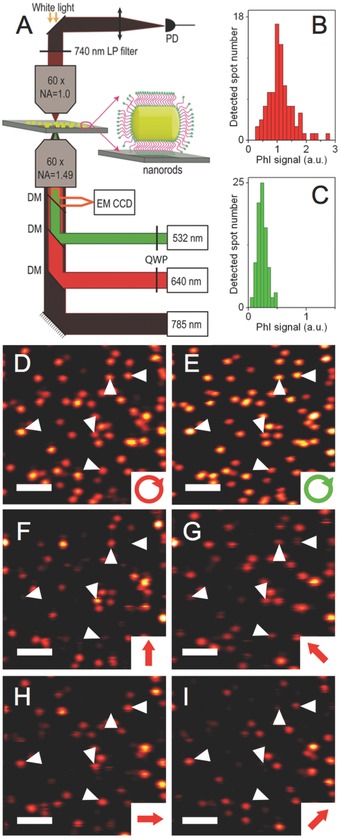
Figure 3.

A) Schematics of the two‐color PhI microscope with excitations at 532 or 640 nm and a probe at 785 nm, B–E) PhI images and PhI signal histograms of nanorods (fraction with 642 nm peak absorption) excited with circularly polarized (D) 640 nm and (E) 532 nm beams. B,C) Corresponding PhI signal histograms. F–I) Same as (D) but with linearly polarized 640 nm excitation beams with orientations as indicated on the figures. Scale bars: 2 µm. Arrowheads indicate the likely orientations of the in‐plane projection of single nanorods long axis.
