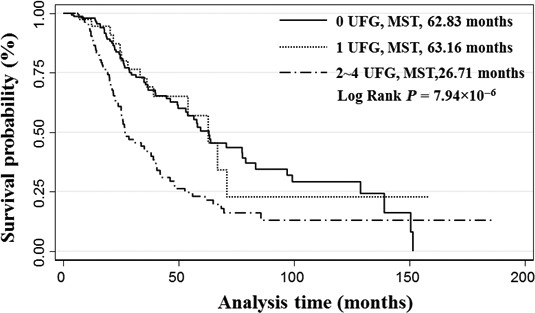
Figure 1.

Kaplan–Meier curve of ovarian cancer patient with different unfavourable genotype. Patients were classified into three different groups based on the number of unfavourable genotypes (UFG) in each patient that was identified from cumulative effect analysis. The median survival time (MST) of each group was compared by the log‐rank test.
