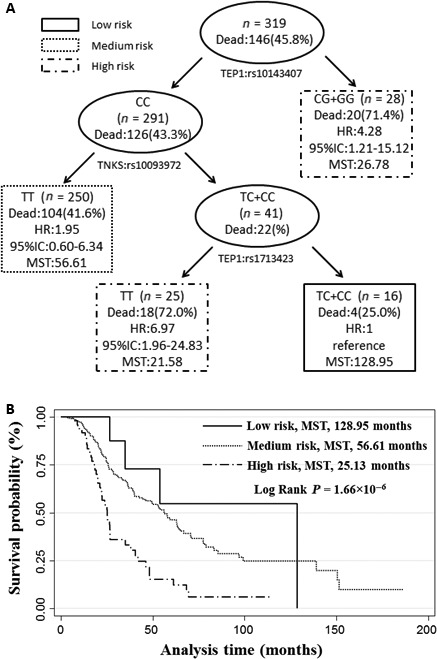
Figure 2.

High‐order interactions of SNPs on modulating the overall survival of ovarian cancer patients. (A) Survival tree using a recursive partitioning method implemented in the STREE program to split the patients into nodes with different risks of death based on the distinct genotype combinations; (B) Kaplan–Meier curve of ovarian cancer patients with distinct genotype combinations. The terminal nodes identified in A were classified into three risk groups (low, medium and high) based on the HR of the terminal nodes. The median survival time (MST) of each group was compared by the log‐rank test.
