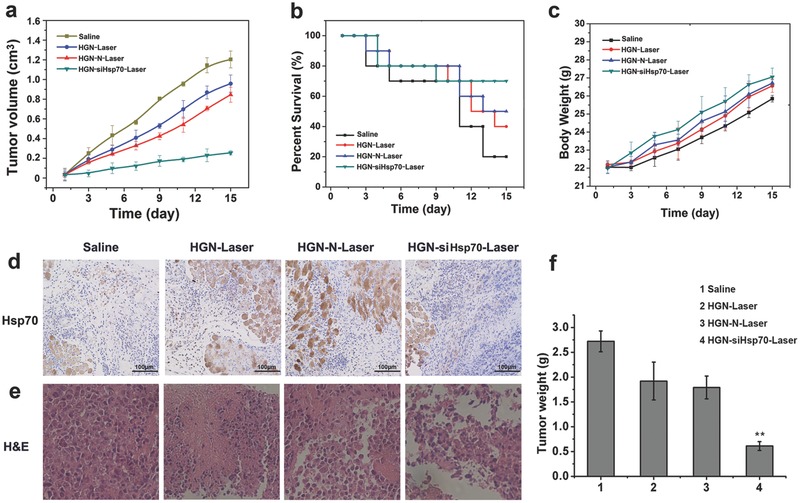
Figure 6.

Photothermal therapy of tumor bearing mice treated with different nanoconstructs. a) Tumor growth curves of mice during the 15 d treatment. b) Survival rates of mice of different treatment groups. c) Animal weight changes of different groups during the treatment period. d) Immunohistochemical assay of Hsp70 expression in tumor tissues of different treatment groups. e) Histological observation of the tumor tissues with H&E staining from different treated groups of mice. f) Weights of tumors harvested from different groups after treatment. Data were given as mean ± SD (n = 10), **P <0.05.
