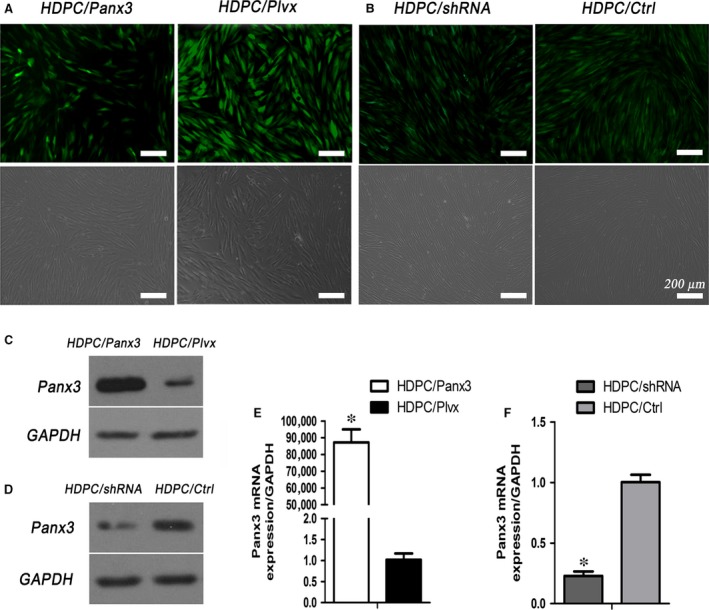
Figure 4.

Lentiviral‐mediated expression of Panx3 in HDPCs. (A, B) Cell images of HDPCs/Panx3, HDPC/Plvx, HDPC/shRNA and HCPD/Ctrl groups were photographed in normal light (lower panels) and under a fluorescence microscope (upper panels). Protein and mRNA expression of Panx3 were determined by Western blot (C, D) and qRT‐PCR (E, F) analysis. *P < 0.05 HDPC/Panx3 versus HDPC/Plvx, and HDPC/shRNA versus HDPC/Ctrl. Scale bar: 200 μm.
