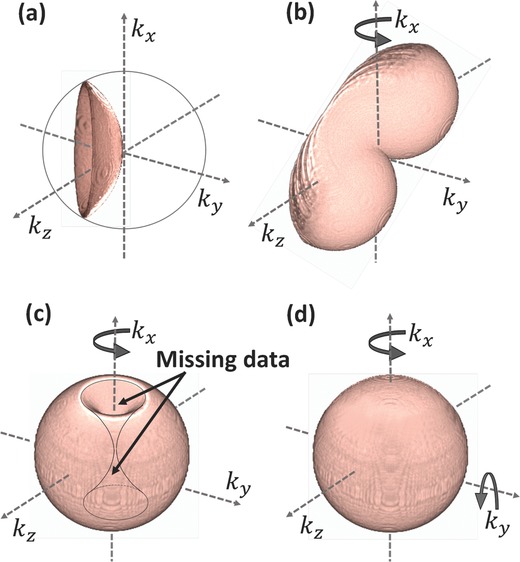
Figure 1.

Mapping of the angular projections in the 3D Fourier space using the diffraction‐theory method in the case of: a) a single projection, b) angular range of 140° around one axis by illumination rotation, c) angular range of 360° around one axis by sample rotation, d) angular range of 360° around two axes by sample rotation, presenting the most complete angular range possible. To create these schematic images, 3D iso‐surfaces of half hemispheres in multiple angles were simulated using Matlab, saved in nii.gz format, and the final renderings were created by MRIcroGL64 software.
