Figure 2.

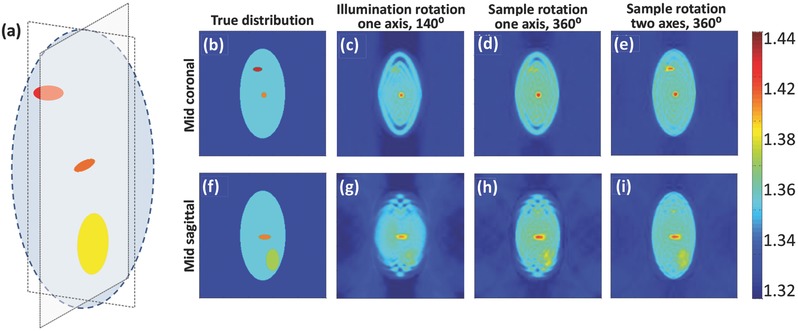
A comparison between the 3D refractive‐index reconstructions obtained by tomographic simulations. a) The input 3D refractive‐index model used. b–e) Mid coronal section of the refractive‐index distribution for: b) the true (input) values, c) the reconstructed values for the illumination‐rotation method, around one axis with 140° angular range, d) the reconstructed values for the sample‐rotation method, around one axis with 360° angular range, e) the reconstructed values for the sample rotation method, around two axes with 360° angular range. f–i) Mid sagittal section of the refractive‐index distribution for the coinciding cases to (b)–(e), respectively. Color bar represents refractive‐index values.
