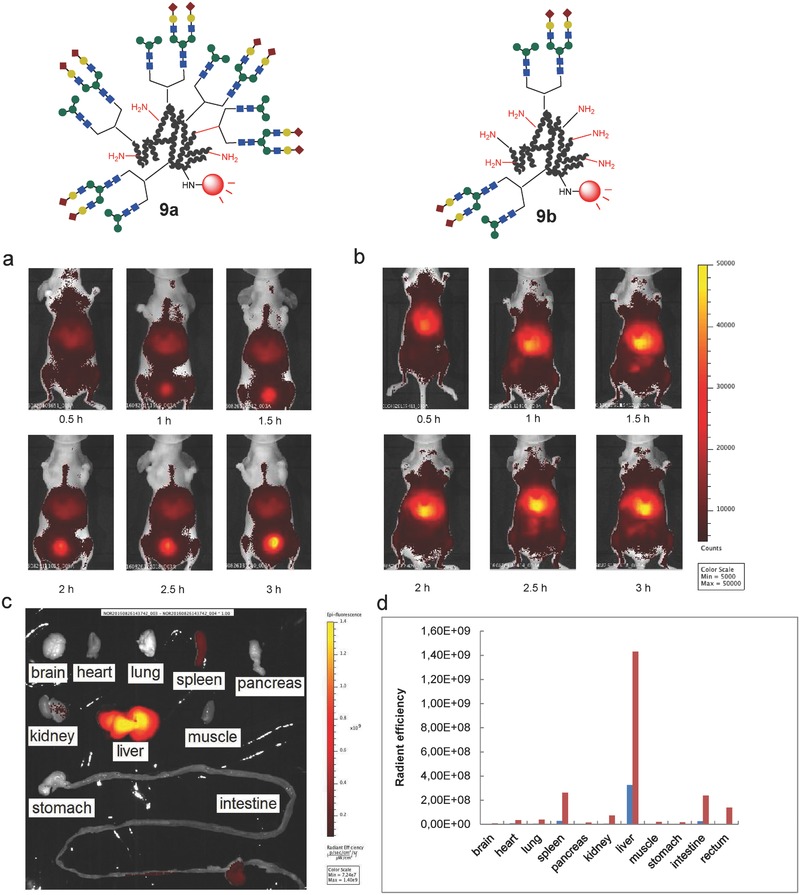
Figure 5.

Noninvasive fluorescence images of the N‐glycoclusters a) 9a and b) 9b in BALB/c nude mice 0.5–3 h after intravenous injection. c) Fluorescence intensities of the dissected organs 3 h after administration of glycoalbumin 9b. d) Comparison of the fluorescence intensities of the dissected organs 3 h after administration of 9a and 9b. Blue: 9a, Red: 9b. See the procedural details provided in the Experimental Section.
