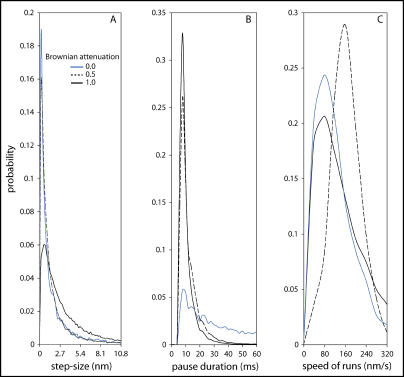
Figure 4. Step-Sizes, Pause Durations, and Speeds of Motion with Different Brownian Simulation Force Attenuation.
The legend shows the multiplier by which the Brownian simulation force on the bacterium is attenuated, such that a multiplier of 1 corresponds to a Brownian simulation force appropriate to an unconstrained bacterium and a multiplier of 0 signifies no simulated Brownian motion of the bacterium (see discussion of the relationship between applied Brownian simulation force and numerical time-step in the model description). We line-fit and filter trajectories by slope (speed) to identify pauses in the bacterial motion. Any line with slope less than the pause threshold might indicate a pause. The distance between adjacent pause locations is the step-size, assembled into a histogram in (A). No characteristic step-size is evident; smaller steps are simply more probable than larger ones. We exclude steps shorter than 0.2 nm. (B) shows a pause duration histogram; here we exclude pauses <8 ms in duration. (C) shows run speed histograms for runs >50 ms in duration. For a Brownian multiplier of 1, we used 30 simulations with 56,239 pause events for (A) and (B) and 6,098 runs for (C) (1,929 s total simulation time, 644 s total paused time, 116 nm/s average speed, pause threshold 40 nm/s). For a multiplier of 0.5, we used 13 simulations with 49,207 pause events and 2,287 runs (1,534 s total simulation time, 700 s total paused time, 93 nm/s average speed, pause threshold 30 nm/s). For a multiplier of 0, we used 18 simulations with 9,748 pause events and 1,179 runs (940 s total simulation time, 612 s total paused time, 56 nm/s average speed, pause threshold 20 nm/s).

