Figure 3.

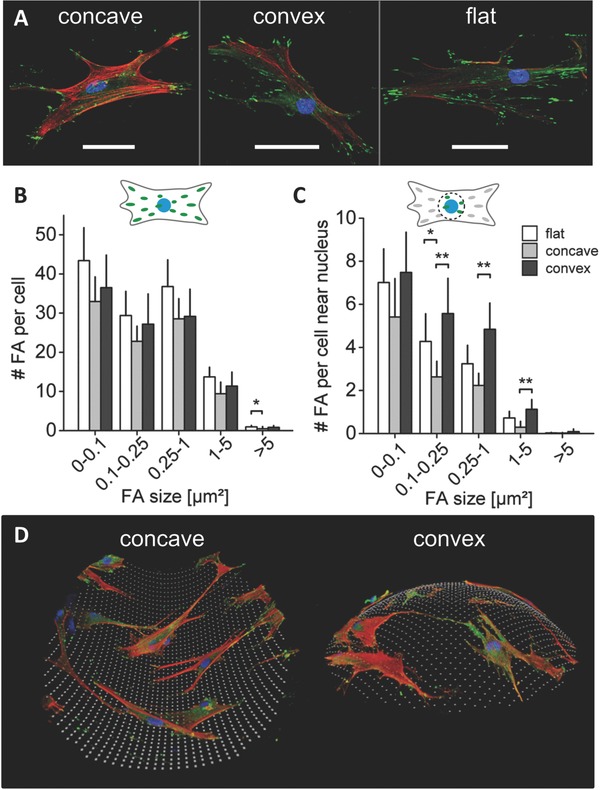
Curvature driven alterations in cell attachment. A) Representative immunohistochemical images of vinculin (green) identifying focal adhesions, F‐actin (red) and nuclei (blue) for hMSCs on concave and convex spherical surfaces (κ = 1/175 µm−1), and a flat surface after 2 d in expansion medium. Scale bar 50 µm. B) Number of total amount of focal adhesions (FAs) per cell, divided into different focal adhesion size classes. C) Number of focal adhesions per cell near the nucleus for the same focal adhesion size classes as in (B). No significant differences were found in the total amount and size of focal adhesions per cell on the different structures. However, near the nucleus a significant lower number of focal adhesions (size > 0.1 µm2) was found in cells in concave surfaces. Mean ± 95% confidence interval. *P < 0.05, **P < 0.01. D) 3D reconstruction of immunohistological stained cells (F‐actin in red, FAs in green, and nuclei in blue) on a concave and convex surface. Cells on concave surfaces showed an upward stretched cell morphology where a substantial part of the cell body is not attached to the surface. Cells on convex surfaces were fully attached to the surface.
