Figure 4.

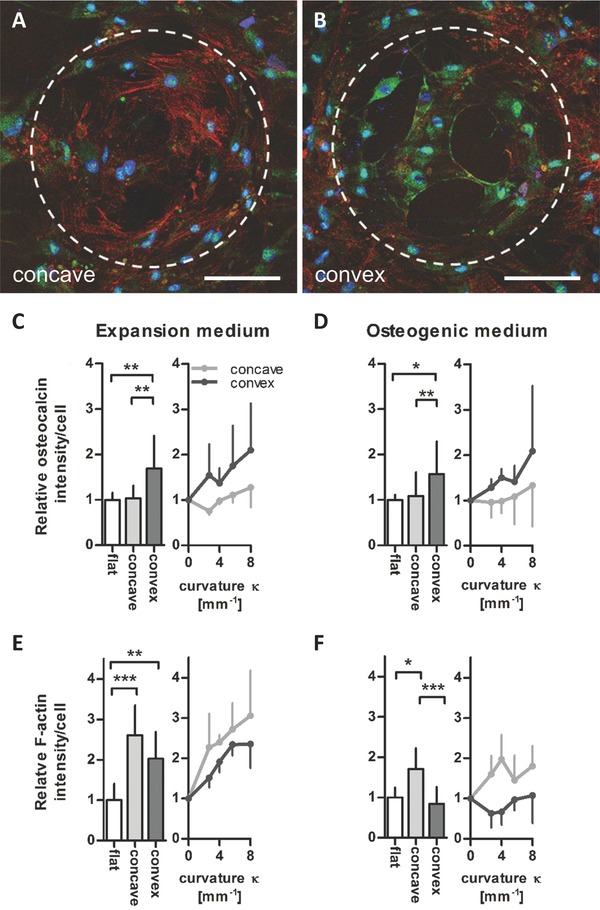
Surface curvature affects the F‐actin cytoskeleton and osteocalcin levels in hMSCs. Representative immunohistochemical images of osteocalcin in hMSCs on A) a concave and B) a convex spherical surface (κ = 1/175 µm−1) after 10 d in osteogenic medium (osteocalcin in green, nuclei in blue, and F‐actin in red). Scale bar 100 µm. Dashed lines highlight the contour of the spherical surface. C–D) Quantification of osteocalcin intensity/cell for different curvatures κ (mm−1) shown as mean values of all concave/convex surfaces (bar charts) and for the individual curvatures investigated (point charts). After 10 d in C) expansion medium and D) osteogenic medium, significant higher levels on convex spherical surfaces compared to flat and concave surfaces were revealed. E,F) Quantified F‐actin intensity/cell levels were highest on concave spherical surfaces after 10 d in E) expansion medium and F) osteogenic medium. Mean ± standard deviation. *P < 0.05, **P < 0.01, ***P < 0.001.
