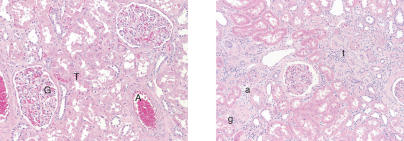
Figure 6. Chronicity Index of Kidney Samples.
Histology from patient 40 is shown on the left, demonstrating a normal glomerulus (G), tubules and interstitial space (T), and arteriole (A), respectively (chronicity score of zero). Histology from patient 62 is shown on the right, demonstrating glomerulosclerosis (g), tubular atrophy and interstitial fibrosis (t), and arterial intimal hyalinosis (a), respectively (chronicity score of ten). Hematoxylin and eosin staining of paraffin-embedded sections.

