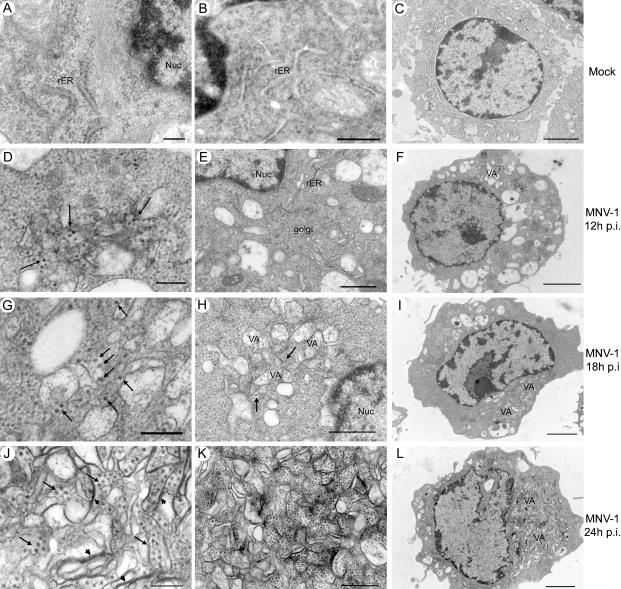
Figure 4. Ultrastructural Studies of MNV-1.CW1-Infected RAW 264.7 Cells.
Cells were infected with MNV-1.CW1 (P3) (MOI of 2.0) (D–L) or mock-infected (A–C) and processed for electron microscopy 12 (D–F), 18 (G–I), or 24 (A–C; J–L) h.p.i. MNV-1 particles are indicated by arrows and confronting membranes by arrowheads. VA, vesiculated areas; Nuc, nucleus; rER, rough endoplasmic reticulum. Scale bars, 200 nm for (A), (D), (G), and (J); 500 nm for (B), (E), (H), and (K); 2 μm for (C), (F), (I), and (L).

