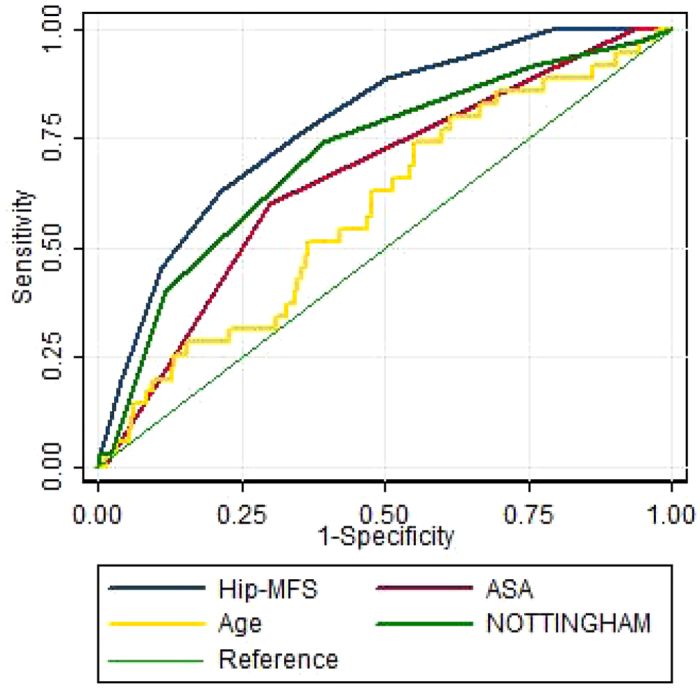
Figure 3. Comparison of area under receiver operating characteristic curve (AUC) for 6-month all-cause mortality rate between Hip-MFS, age, ASA classification and NHFS.

Graph showing highest AUC area in Hip-MFS (0.78) than age (0.58), ASA classification (0.67) and NHFS (0.70) with statistical significance with p value of 0.049, 0.001 and 0.033, respectively.
