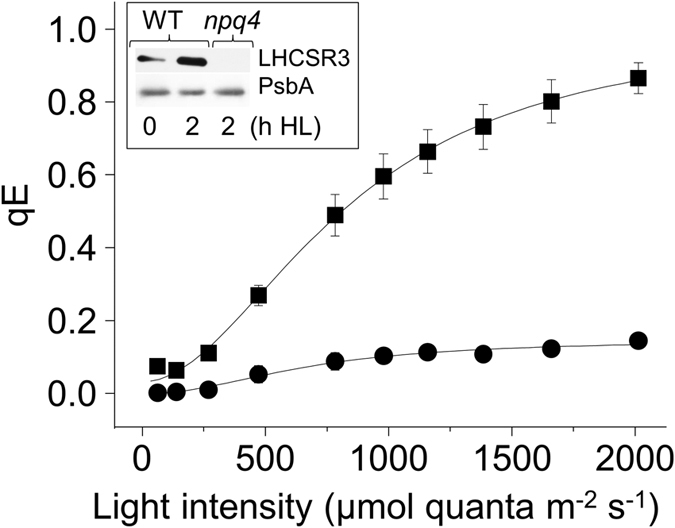
Figure 1. The qE phenotype of npq4.

The NPQ parameter of qE was measured at the indicated light intensities in wild-type (squares) and npq4 (circles). Cells were pre-treated with high light for 2 h and recovered for 1.5 h before measurements, n = 3 ± SD. The western blot inset shows the accumulation of LHCSR3 in 0 and 2 h treated wild-type cells and its absence in npq4. Supplementary Figure S5 shows an uncropped blot. The D1 subunit of PSII (PsbA) is shown as loading control.
