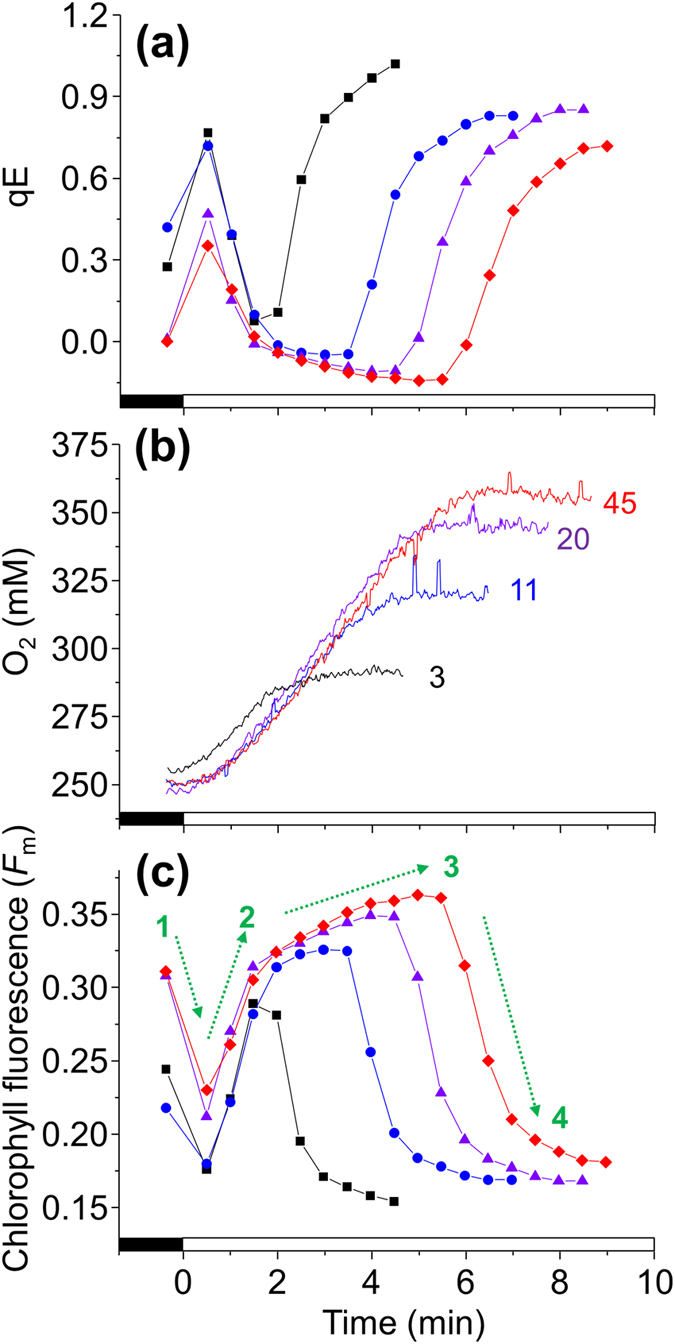
Figure 4. The state II to I transition of qT and qE induction during dark to light exposure.

Pre high light-treated wild-type cells were placed in state II by dark-adapting for various intervals. Actinic light at 474 μmol quanta m−2 s−1, as used to induce a transition to state I and activate qE, is indicated by the white bar on the X-axis. (a) The qE of cells dark adapted for 3 min (squares), 11 min (circles), 20 min (triangles) or 45 min (diamonds), calculated for all using the Fmo after 45 min dark adaptation. (b) O2 content of the media (lines are labelled with the time of dark adaption) simultaneously measured during a fluorescence quenching analysis. (c) The Fm’ values used to calculate qE using the same symbols in (a). In (c) the dashed green arrows of Fm changes indicate 1) rapid qE of state II cells, 2) rapid qT transition to state I, 3) slower qT transition to state I, and 4) qE of state I cells (see text for details).
