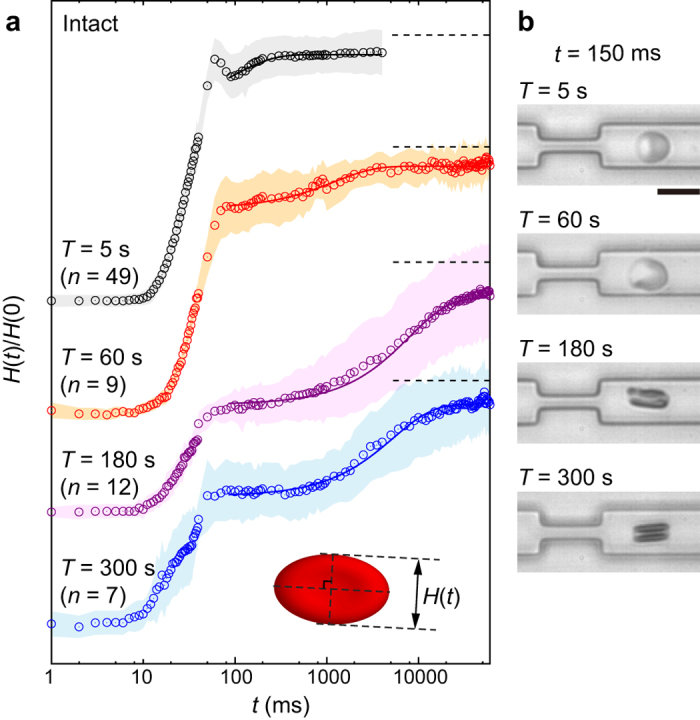
Figure 5. Change in cell height H(t) over time, recorded for intact erythrocytes for the different loading times T: 5 s, 60 s, 180 s, and 300 s.

(a) Normalized cell height H(t)/H(0). The standard deviations and the fitting curves are represented by shaded areas and solid lines, respectively. Dotted lines represent H(t)/H(0) = 1 for each T. Each number of samples n is shown above the graph. Inset shows the definition of H(t), which is measured along minor axis of the shape. (b) Representative snapshot image for each T. Scale bar is 10 μm.
