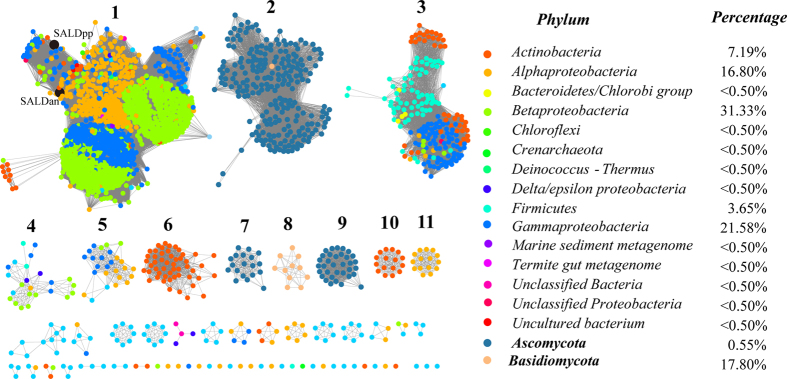
Figure 1. Taxonomic distribution of SALDs.
The proteins listed in Supplementary Dataset 1 were used to generate the network using an e-value of 10−150 (>60% sequence identity). Each node represents one protein. Edges are shown with BLASTP e-values below the indicated cutoff. A cluster was sequentially labeled if there were more than 10 nodes in that cluster. Nodes from the same taxonomic groups in the global network are the same color. The nodes representing SALDan and SALDpp are highlighted by a black coloration and large size. The colors corresponding to each phylum and protein percentage in each phylum are listed on the right.

