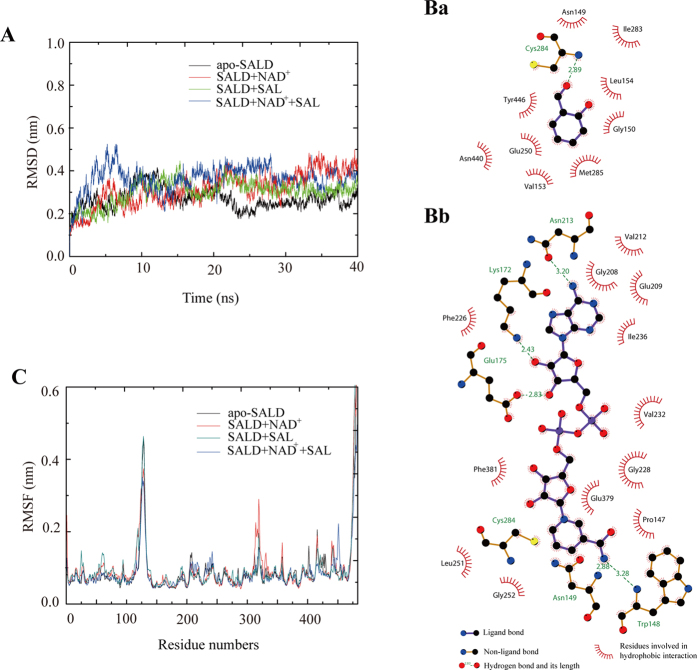
Figure 4. Molecular dynamic analysis of SALDan.
(A) Backbone RMSDs are shown for SALDan and SALDan complexes at 300 K. Black coloration indicates apo-SALDan; SALDan with NAD+ is shown in red; SALDan with SAL is shown in green; and SALDan with both NAD+ and SAL is shown in blue. (B) The substrate and cofactor binding sites. A two-dimensional representation of ligand–protein interactions for the SALDan–SAL (a) and SALDan–NAD+ (b) complexes. (C) RMSF of the residue positions of SALDan and SALDan complexes at 300 K. Apo-SALDan, SALDan with NAD+, SALDan with SAL, and SALDan with both NAD+ and SAL are shown in black, red, blue, and green, respectively.

