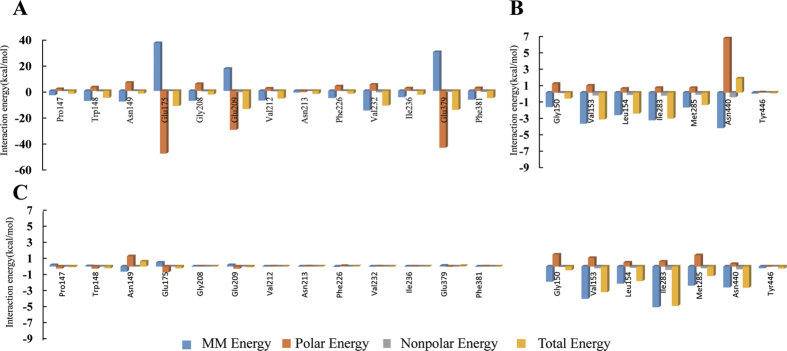
Figure 5.
The decomposition of the binding energy on a per-residue basis in the binding sites of the SALDan–NAD+ complex (A), SALDan–SAL (B), and SALDan–NAD+-SAL complex (C). (Blue histograms: molecular mechanics energy; orange histograms: polar energy; gray histograms: nonpolar energy; yellow histograms: total energy).

