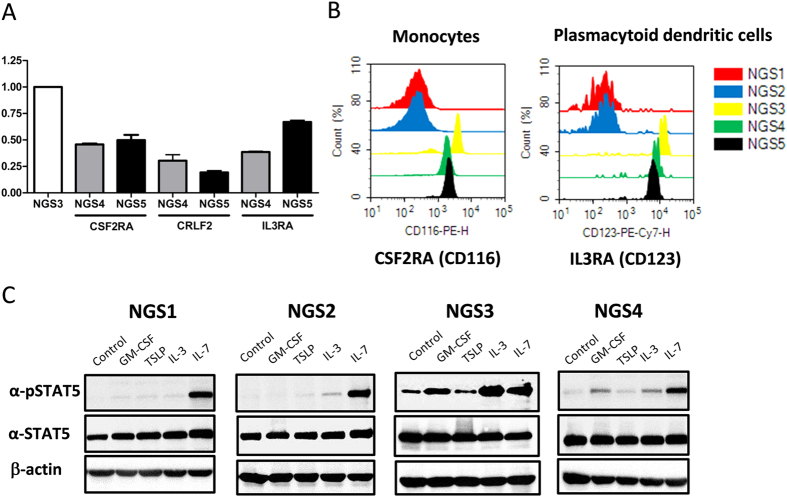
Figure 3. Quantitative real-time PCR analysis, flow cytometry and signaling pathway analysis of CSF2RA, CRLF2, and IL3RA gene expression.
(A) Quantitative RT-PCR revealed a decrease in expression of these genes in NGS4 and NGS5 (parents) compared to NGS3 (healthy girl). (B) Histograms showed the shift in the fluorescence intensity that was seen for the monocytes (PE-labeled anti-human CSF2RA antibody) and for the plasmacytoid dendritic cells (PE-labeled anti-human IL3RA antibody) in NGS3, NGS4 and NGS5. (C) PBMCs stimulated with recombinant human GM-CSF and IL-3 but not TSLP revealed the phosphorylation of STAT5 in NGS3 and NGS4. Extremely low STAT5 phosphorylation was detected in PBMCs with GM-CSF, TSLP and IL-3 stimulation in NGS1 and NGS2. Negative control was cell incubated with PBS without stimulant individually. Cropped blots were shown for clarity. Full-length blots/gels are presented in Supplementary Fig. S1B.

