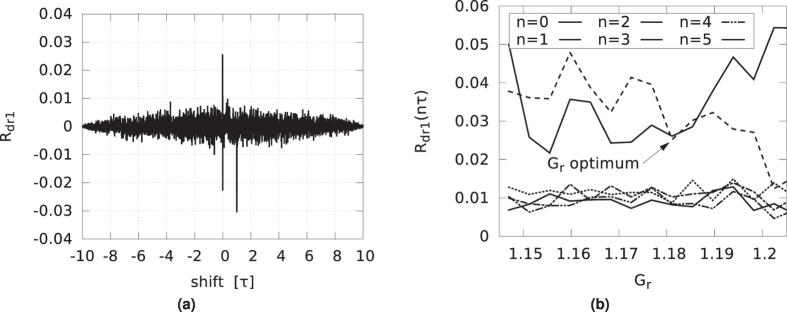
Figure 8.
(a) Normalized cross-correlations of driver and responder 1, at optimal gains Gd and Gr. The horizontal units are delay loop lengths τ. (b) Absolute value of the normalized cross-correlation function Rdr1 of the driver and responder 1 at multiples of the delay time τ, plotted against gain Gr.

