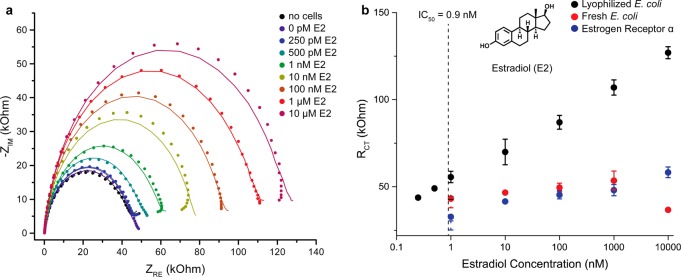
Figure 2.
Electrochemical sandwich assay for endocrine disrupting compounds (EDCs). (a) Nyquist plots of estradiol detection with the platform at concentrations ranging from 0 pM to 10 uM, along with the CPE fits used to determine the charge transfer radius (RCT). (b) Estradiol concentration dependent RCT for ERα (blue), ERα on live E. coli (red), and ERα on lyophilized E. coli (black). Error bars represent the SD for n = 3 replicates.

