
Figure 1. Tracks of the 43 southern elephant seals equipped with CTD-SRDLs from 2004 to 2014.
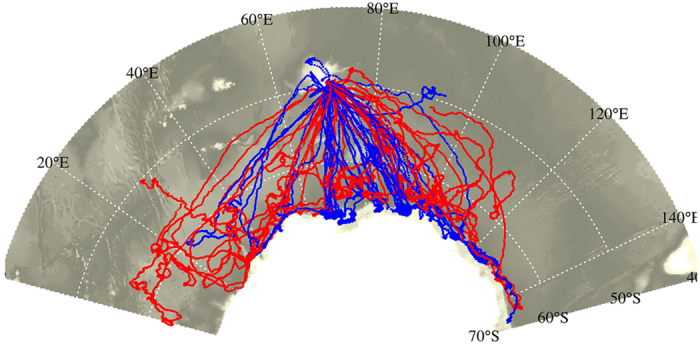
Their movements and diving behaviour were collected during their post-moult foraging trip from the breeding colony in Kerguelen Islands to the Antarctic sea ice zone. Red and blue colours represent the 21 females and 22 males, respectively. The map was made using R software, version 3.2.4 revised (R Core Team (2016). R: A language and environment for statistical computing. R Foundation for Statistical Computing, Vienna, Austria. URL https://www.R-project.org/). The bathymetry represented in grey shading is from The GEBCO_08 Grid, a global 30 arc-second grid largely generated by combining quality-controlled ship depth soundings with interpolation between sounding points guided by satellite-derived gravity data. URL http://www.gebco.net/data_and_products/gridded_bathymetry_data/.