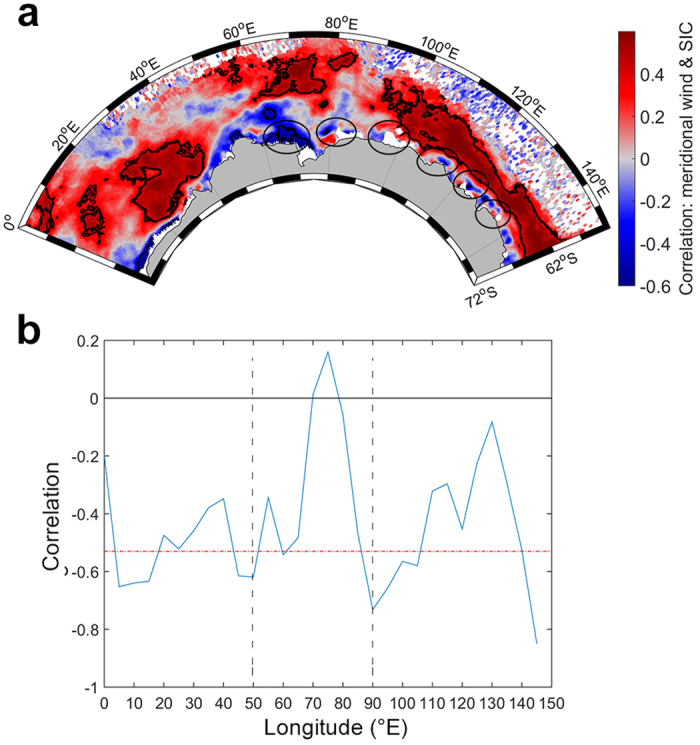
Figure 4. Relationship between 10 m wind meridional component and sea ice patterns from 2004 to 2014.

Per-pixel Spearman correlation coefficient between monthly ERA-Interim 10 m wind meridional component anomaly and monthly sea ice concentration (SIC) anomalies from 2004 to 2014 is represented for the winter season (June-August), with contours denoting statistical significance at the 95% level. Ellipses represent coastal polynya sites, from left to right: Cape Darnley/Mackenzie, Barrier, Shackleton, Vincennes Bay, Dalton, and Dibble (a). For each 5 degree longitude bin, monthly ERA-Interim 10 m meridional winds anomalies were averaged within the minimum and maximum latitude band of average day of advance from 2004 to 2014. The correlation values from Spearman correlation between sea ice advance anomalies and averaged 10 m wind anomalies meridional component for each 5° bin of longitude are represented by the blue line; the significance of the negative correlation is represented by the dotted red line (b). For panel (b), the two dotted black lines delineate regions of interest discussed in the text. For illustration purposes, autumn correlation for sea ice concentration (March-May) is not represented. Map in panel (a) was made using MATLAB software (version 8.5.0.197613 (R2015a), URL http://fr.mathworks.com/).
