
Figure 2. Distribution and CRC risk of the genetic risk score in cases and controls.
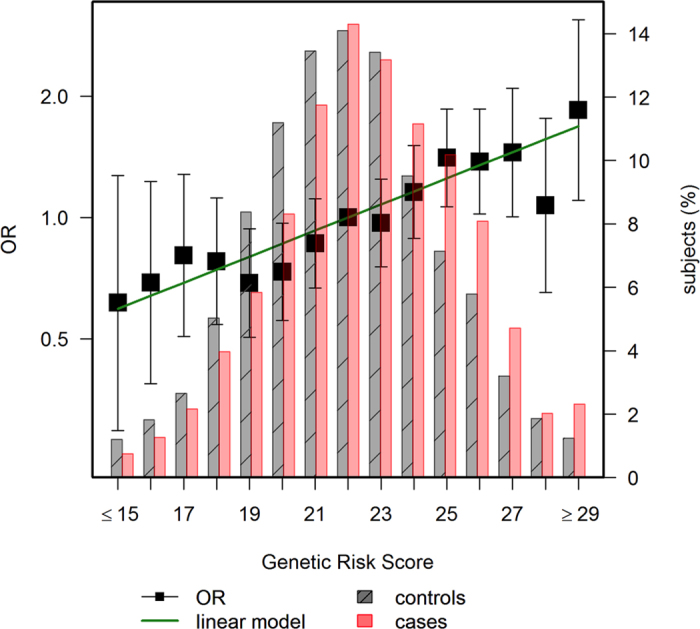
The left axis scale indicates the OR for CRC according to the number of risk alleles. The group of 22 alleles was selected as reference category (OR = 1), because this is the average in the population. The right axis scale indicates the proportion of cases and controls shown in bars for each allele.