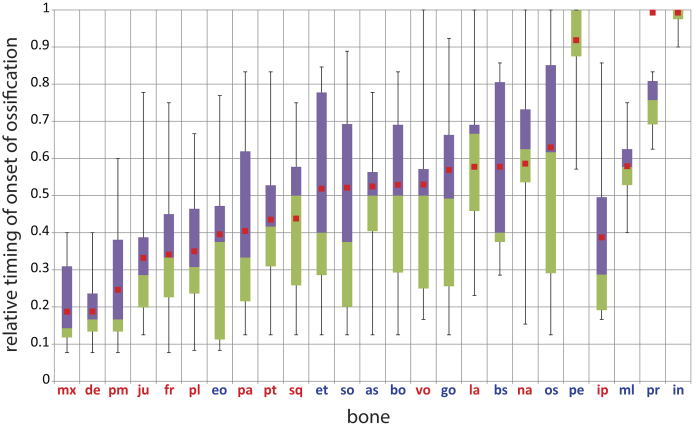
Figure 3. Boxplot comparison showing the range of variation for the relative timing of the onset of ossification.
The 25th percentile is marked by the lower edge of the box, the 75th percentile by the upper end. The median is marked by the boundary between the purple and green parts of the box. The upper and lower whiskers mark the maximal and minimal value, respectively. The reconstructed timing of the onset of ossification for each bone in the marsupial ancestor is shown by the red squares. The bones are ordered by the onset of ossification in the ancestor of all marsupials. Bones colored in red are of dermal origin, bones colored in blue of endochondral origin (sensu Koyabu et al.29 and Hall55). The variation in onset of ossification is very large for all bones and the reconstructed ossification sequence follows previous authors in that the bones surrounding the mouth cavity are among the first bones to ossify22,23,29. For a graphic representation of the onset timing for each individual species see Suppl. Fig. 1. The values for this graph can be found in Suppl. Table 2.

