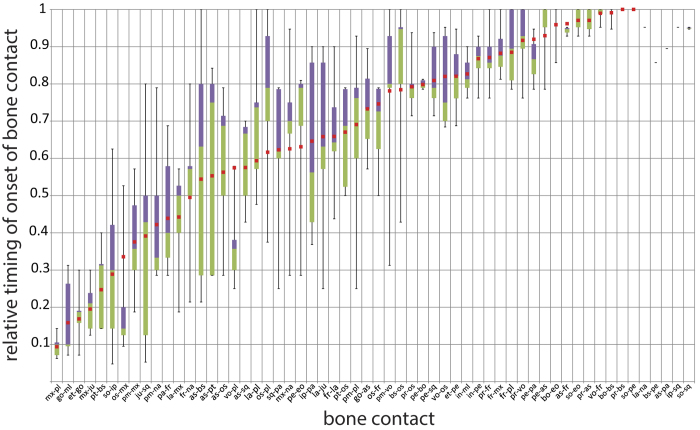
Figure 6. Boxplot comparison showing the range of variation for the relative timing of the bone contacts.
The reconstructed timing of bone-to-bone contact of the last common ancestor of all studied species (Australidelphia) is marked by the red squares. The bone contacts are ordered based on the bone contact sequence in the last common ancestor. The bone contacts clearly show less variation in timing than bone onset (see Fig. 3). The contacts of the occipital and middle ear regions, as well as the contacts of the petrosal and the maxilla-palatine contact show especially little variation. The values for this graph can be found in Suppl. Table 3.

