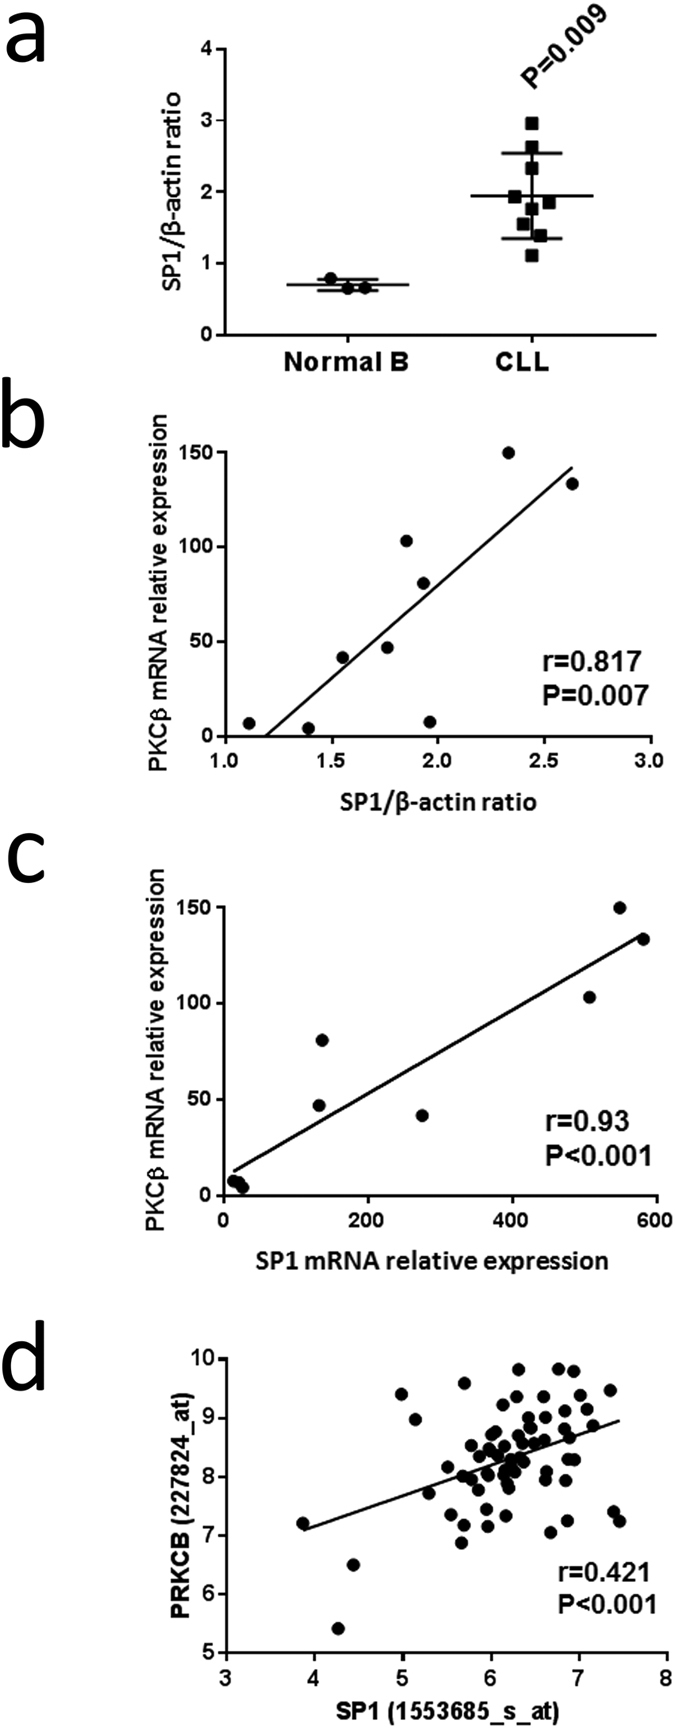
Figure 6. SP1 is overexpressed in CLL cells, and expression correlates with PRKCB transcription.

(a) SP1 protein expression relative to β-actin was determined in lysates of purified normal B and CLL cells by Western blot analysis. 10 μg of protein was used for each sample, and the ratio of SP1 to β-actin was determined following imaging of chemoluminescence. Statistical analysis was performed using a Mann-Whitney U-test. (b) Graph showing the relationship between SP1 protein expression and PKCβ mRNA levels, determined by qRT-PCR, in purified CLL cells. (c) Graph showing the relationship between SP1 and PKCβ mRNA levels, determined by qRT-PCR, in purified CLL cells. (d) Graph showing relationship between SP1 and PRKCB gene expression in CLL cells taken from publically-available data stored on the Immuno-Navigator database37.
