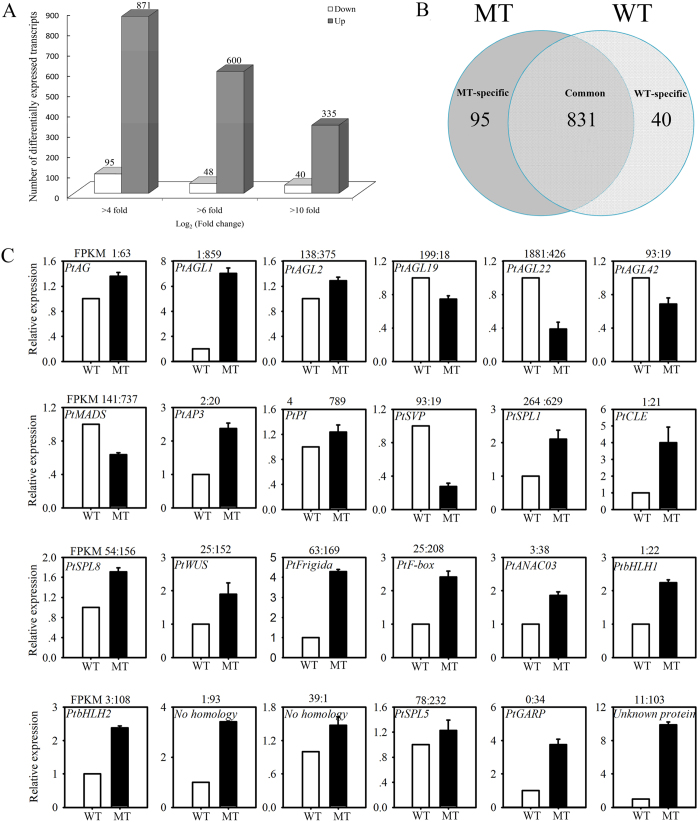
Figure 5. Differential expression of protein-coding genes.
(A) The total numbers of differentially expressed transcripts (|log2 ratio| ≥ 4, 6, and 10; P < 0.05) between MT and WT. (B) Venn diagram showing the differentially expressed transcripts between MT and WT. (C) Real-time PCR validation of RNA-Seq data showing the accumulation of 24 randomly selected flowering-related transcripts between WT (white columns) and MT (black columns); the abundance of protein-coding genes from RNA-seq data is shown above each gene. Relative transcript levels are calculated by real-time PCR with β-actin as the standard. Data are means ± SE of four separate measurements. The gene ID from the citrus genome database (https://phytozome.jgi.doe.gov/pz/portal.html#!info?alias=Org_Cclementina).

