
Figure 2.
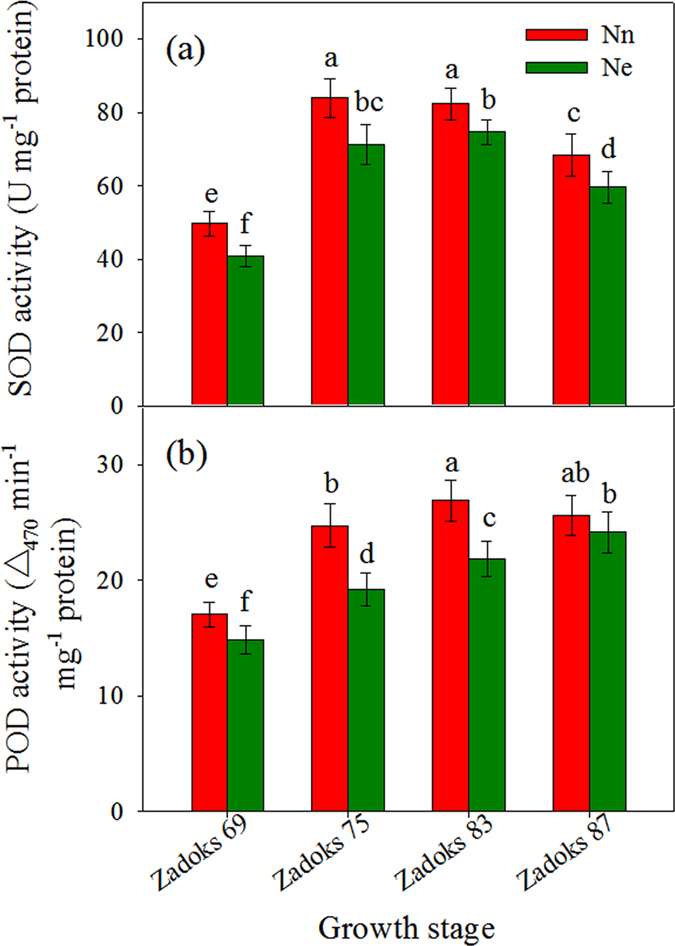
Comparison of the activities of SOD (a) and POD (b) in flag leaf from the Nn and Ne treatments. Each value represents the mean ± SD from four independent samples. The columns labeled with different letters are significantly different at p < 0.05 according to Duncan’s test for multiple comparisons using DPS software.