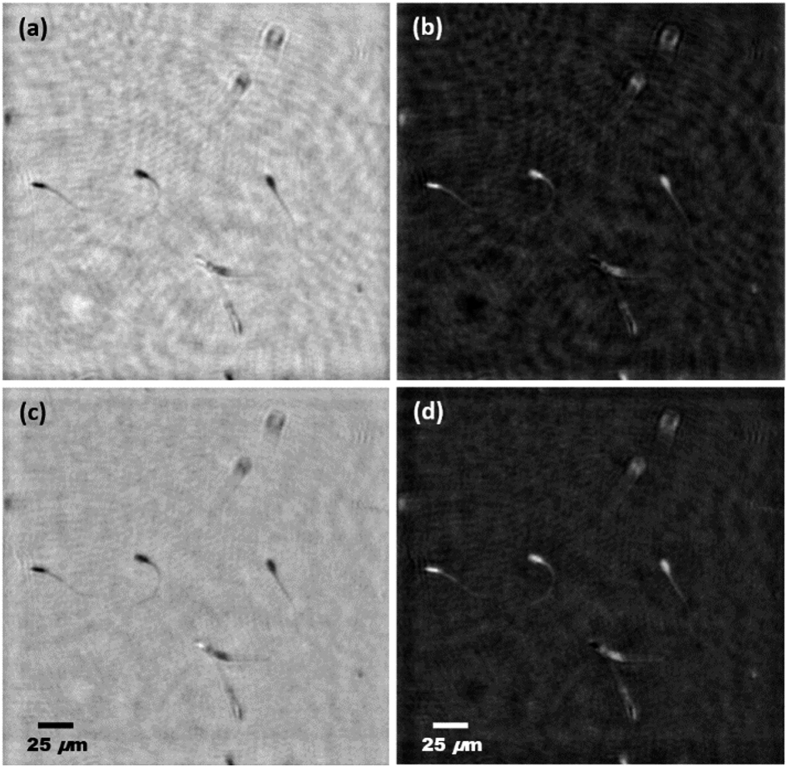
Figure 5. Results for MISHELF microscopy using detuned illumination/detection with alive sperm biosample.
Images (a,b) and (c,d) represent, respectively, the phase distribution when considering B-LHM and our IRRB scheme for positive [(a) and (c)] and negative [(b) and (d)] phase contrast visualization. In addition, the whole image sequence for each case is included from Video1.mov to Video4.mov, respectively (2.4MB per video movie).

