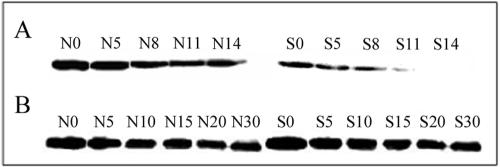
FIG. 5.
σs protein half-life determined by quantitative Western analysis during the exponential (A) or stationary (B) phase of growth; representative Western blots are shown. N values (N0, N5, etc.) and S values (S0, S5, etc.) represent sampling time points in minutes under NG and SMG conditions, respectively.

