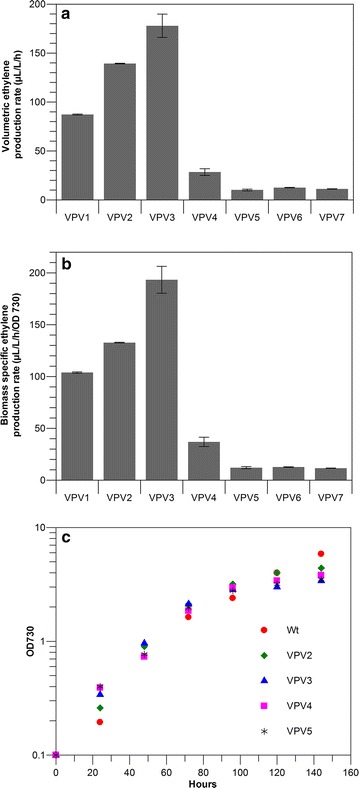
Fig. 1.

Rate of ethylene production in Synechocystis strains expressing the efe gene under control of the Ptrc promoter and various RBSs. a Comparison of volumetric ethylene production rates; b comparison of biomass specific ethylene production rates; c typical growth curves of the wild-type and ethylene producing Synechocystis strains. The genetic makeup of the VPV strains is detailed in Table 1. Error bars indicate standard deviation for triplicate measurements
