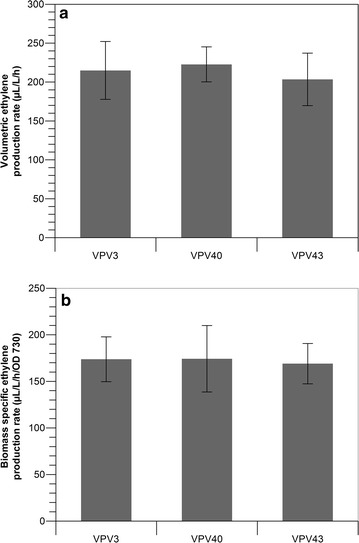
Fig. 2.

Rates of ethylene production form Synechocystis strains expressing the efe gene under control of in-tandem promoters. a Comparison of the volumetric ethylene production rate; b comparison of the biomass-specific rate of ethylene production. Error bars indicate standard deviation for triplicate measurements
