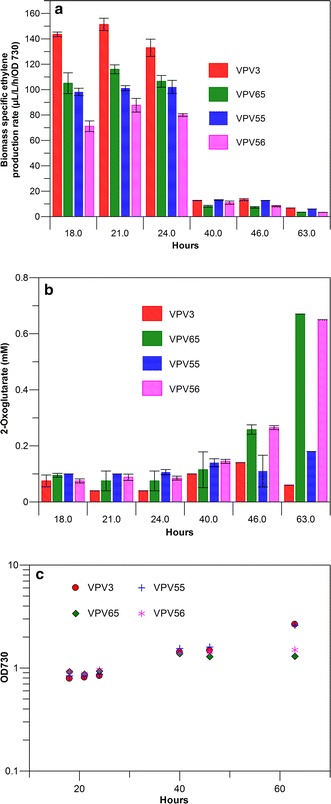
Fig. 4.

Comparison of ethylene production in wild type and in a ∆glgC strain, with a plasmid- and a chromosome-incorporated efe gene. a Comparison of Biomass-specific ethylene production rates between wild-type Synechocystis strains expressing the efe gene from a plasmid (VPV55) or as a chromosomal integration construct (VPV3), in comparison to the glycogen-synthesis deficient Synechocystis strains expressing the efe gene on a plasmid (VPV56) or as a chromosomal integration construct (VPV65) under nitrogen limitation conditions, induced by growing the cells in nitrogen-restricted medium. b 2-Oxoglutarate measured in the supernatants of the ethylene-producing strains after measurement of the rate of ethylene-production. c Typical growth data of the mutant strains during the period in which the ethylene production experiments were conducted. Error bars indicate standard deviation for triplicate measurements for (a) and standard deviation for duplicate measurements for (b)
