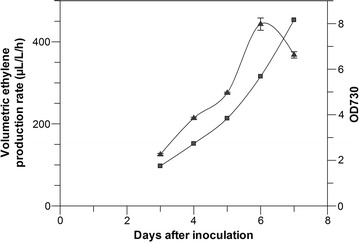
Fig. 5.

Ethylene production and growth with aerated batch cultivation. Volumetric ethylene production (filled triangles, levels indicated on the left y-axis) and OD730 (filled triangles, levels indicated on the right y-axis) plotted against time after inoculation. Error bars indicate standard deviation for triplicate measurements. Lines in the figure serve as a guide to the eye
